5 Tips on Semi vs Fully Automatic Packaging Differences?

Time:2026-09-26 Author:Sophia
0%

Choosing between semi-automatic and fully automatic packaging starts with a practical question: what is the difference between semi automatic and fully automatic packaging on your production floor? The answer is not simply “less labor” or “more speed.” It depends on how products move, where workers intervene, and whether each machine can keep pace with the rest of the line.

A semi-automatic setup might require an operator to place a carton, trigger a cycle, or check a seal. You can see the work happen: a hand positions a pouch, a foot pedal starts the sealer, and finished packs gather beside the station. Fully automatic equipment can feed, fill, seal, and convey products with less routine handling. But automation is not magic. A poorly matched filler can leave a fast wrapper waiting.

Packaging automation consultant Sean Riley is often associated with this practical principle: “Automate the bottleneck, not the machine.” I can’t verify that wording as a published quotation, so treat it as an editorial summary, not a sourced quote. It points to a useful reality: the best choice depends on output targets, product variation, labor availability, floor space, and changeover time. A small team may value flexibility more than maximum speed. A growing plant may need consistent throughput and fewer manual handoffs. There is no perfect setup for every line. The comparison ahead examines five decision points—and some trade-offs deserve a closer look before you invest.
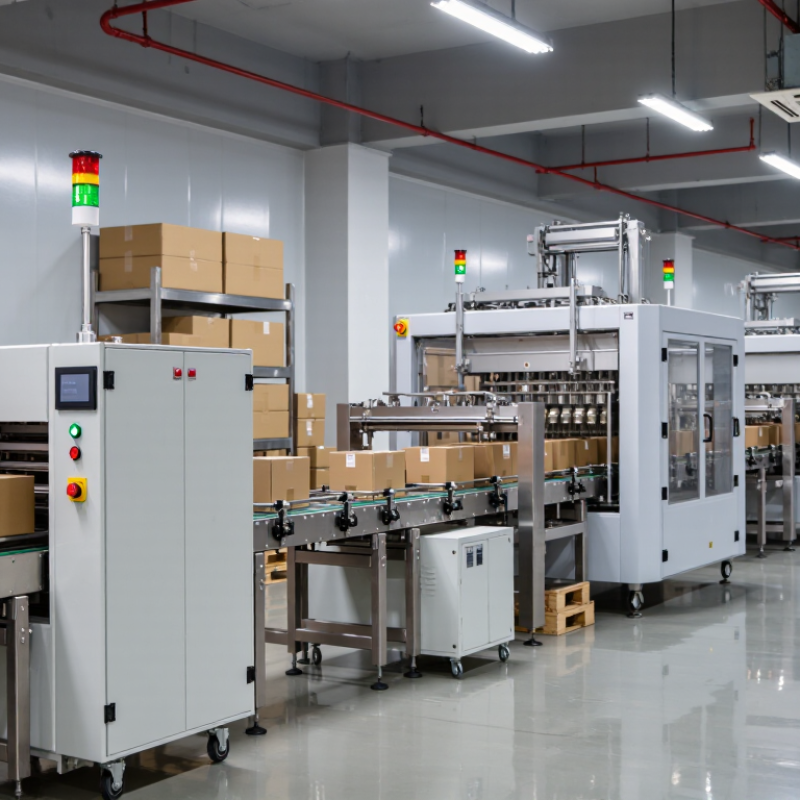
5 Tips on Semi vs Fully Automatic Packaging Differences?

Define Semi-Automatic and Fully Automatic Packaging by Operator Involvement

Semi-automatic packaging keeps a person directly involved in each production cycle. An operator may place a product, position a carton, or start a sealing machine by pressing a pedal. The machine performs a defined task, but a worker handles loading, transfer, or inspection. On a small packing bench, the operator might load a pouch, trigger the sealer, then move the finished pack.

Fully automatic packaging links steps with conveyors, sensors, and controls. Products move through filling, sealing, and labeling with little routine handling. Staff still replenish materials, clear jams, and check quality. That distinction matters.

The International Federation of Robotics reported 4,281,585 industrial robots operating in factories worldwide in 2023, a 10% increase from 2022, in World Robotics 2024. This reflects broad factory automation, not packaging lines alone. It does show why companies are assessing automation.

The practical choice depends on volume, product variation, floor space, and the cost of operator time. A highly automated line may reduce repetitive handling, yet require more setup knowledge and maintenance. The boundary can blur.

Tips: Watch one complete shift before choosing equipment. Record how often workers load, reposition, inspect, and clear stoppages. Compare those tasks with the expected output rate, not just the machine’s advertised speed. A fast line can still wait on hand-loading. And real production is rarely tidy. Recheck the figures after a product change or busy season.

Compare Rated Throughput in Units per Minute and Actual Line Output

A rated speed is a starting point, not a production promise. Ask whether the figure means filled packs, sealed packs, or finished units per minute. Those are not always the same count. Check the test conditions, too: product size, packaging material, and operating time can all affect the result. This comparison is easy to get wrong.

For semi-automatic equipment, include the time an operator spends loading, positioning, or removing each pack. A machine rated at 40 units per minute might deliver 26 during a normal shift if hand-feeding creates gaps. Fully automatic lines reduce some manual steps, but their output still depends on feeders, conveyors, inspection, and downstream equipment. One slow station can hold everything back. Watch a complete line run, not just the packaging machine.

Compare actual output over a representative period, such as a full hour with routine stops and product changes. Record good units, rejected packs, and downtime separately; otherwise, the number can look better than it is. Ask for results using your product and materials. Then check operator requirements, changeover time, and how often jams occur. A short demonstration can flatter any system. Even a careful test may miss a difficult shift, so leave room for uncertainty when estimating capacity.

Map Labor, Loading, and Discharge Tasks Across Both Packaging Setups

Compare the work around each machine, not just its cycle speed. With a semi-automatic setup, an operator may place a pouch or carton, start the cycle, then remove the finished pack. Record how often this happens and how long each action takes during a normal shift. Small delays matter. A fully automatic line can feed and discharge packs with less direct handling, but someone still replenishes materials, checks alignment, and responds to stoppages. The actual labor difference depends on package size, run length, and how reliably the equipment runs.

Map loading and discharge as separate tasks. Note who brings film or cartons to the line, fills the hopper, clears finished packs, and moves them to the next station. A simple task sheet with time, frequency, and operator initials can reveal whether one person is serving multiple machines. Watch a real production run; planned staffing figures may miss awkward reaches or short waits. That is measurable. Still, a tidy spreadsheet can overlook the worker who repeatedly turns to stack cartons. Include changeovers, routine cleaning, and safe jam response in the comparison, following the equipment’s operating procedures. These tasks may shift between setups, rather than disappear.

Calculate OEE Using ISO 22400-2: Availability × Effectiveness × Quality Ratio

5 Tips on Semi vs Fully Automatic Packaging Differences?

Calculate OEE Using ISO 22400-2: Availability × Effectiveness × Quality Ratio

ISO 22400-2 defines OEE through three factors: availability, effectiveness, and quality ratio. Calculate each over the same planned production period. For example, a line running 90% of planned time, at 80% of its ideal rate, with 98% good output, scores 70.6% OEE. Small losses compound.

Compare semi-automatic and fully automatic lines with identical product, shift, and measurement rules. On a semi-automatic line, an operator loading cartons may create brief stops that reduce availability. On a fully automatic line, a misaligned sensor can halt the conveyor for longer. Record the cause, duration, and rejected units; otherwise, the number hides the problem.

A 2024 Smart Manufacturing Survey of 600 manufacturing executives reported that 92% expect smart manufacturing to drive competitiveness within three years. That is investment intent, not proof that automation improves OEE. Check actual shift logs. A small miss matters.

When effectiveness falls, compare observed output with the line’s rated output for that product, not a different format’s speed. When quality ratio drops, separate startup rejects from recurring seal or fill defects. The comparison may still be imperfect: manual interventions are not always logged consistently. Review the definitions with operators before trusting the trend.

Assess Performance Against Vorne’s 85% World-Class OEE Benchmark

Semi-automatic packaging often offers flexible changeovers, but operators can create uneven cycle times. Fully automatic lines reduce manual handling, yet jams and long changeovers still lower output. Compare both against the 85% world-class OEE benchmark, using availability × performance × quality. Treat it as a reference, not a promise. A line at 72% may lose hours to brief stops, slow feeding, or rejected seals.

Tip: Record each shift’s planned production time, good units, and stop reasons. In the 2024 State of Smart Manufacturing Report, 95% of surveyed manufacturers said they had invested or planned to invest in smart manufacturing. That signals growing interest in connected operations, not guaranteed OEE gains. Start with reliable machine-level data before buying more automation.

Tip: Time a real product changeover. Note minutes spent clearing film, adjusting guides, and confirming the first acceptable pack. Small pauses matter. Then compare OEE by product and shift, not just by machine. Averages can hide a difficult format or a recurring night-shift fault. Be wary of perfect dashboards; manual stop codes are often inconsistent, and teams may need to revisit them.

FAQS

What does a machine’s rated speed actually tell me?

It is a starting point, not a production promise. Check whether the rate counts filled packs, sealed packs, or finished units.

Why might actual output be lower than the rated speed?

Hand-feeding, routine stops, and slow downstream stations can reduce output. A machine rated at 40 units per minute might produce 26 during a normal shift.

How should I compare real output between setups?

Watch a complete line run for a representative period, such as one full hour. Count good units, rejected packs, and downtime separately.

Which test conditions should I check?

Use your product and packaging materials. Product size, operating time, and packaging material can all affect the result.

What should I observe during a production run?

Watch feeders, conveyors, inspection, and downstream equipment. One slow station can hold everything back. Watch the full line.

How do I compare operator workload?

Record loading, positioning, starting cycles, and removing packs. Small delays matter. Note how often each task happens during a normal shift.

Does an automatic line remove all manual work?

No. Workers may still replenish materials, check alignment, and respond to stoppages. Tasks may shift between setups rather than disappear.

What details can a task sheet reveal?

Record task time, frequency, and operator initials. Track who brings cartons, fills hoppers, clears finished packs, and moves them onward. A tidy spreadsheet can still miss an awkward reach.

What should I include when estimating capacity and staffing?

Include changeovers, routine cleaning, jam response, and operator requirements. Short demonstrations can flatter a system, so leave room for uncertainty. I may still miss a difficult shift.

Conclusion

Choosing between semi-automatic and fully automatic packaging starts with understanding how much operator involvement each setup requires. Semi-automatic systems typically rely on workers to load, position, or transfer products, while fully automatic lines coordinate these tasks with machinery. To compare them fairly, look beyond rated units per minute: actual output also depends on loading speed, discharge flow, changeovers, and interruptions.

Map every labor task in both setups, then assess performance using OEE: availability multiplied by effectiveness and quality ratio, as defined in ISO 22400-2. This helps reveal whether automation improves productive output or simply reduces hands-on work. An 85% OEE level is often cited as a world-class benchmark, but it should be treated as a reference rather than a guarantee. Ultimately, what is the difference between semi automatic and fully automatic packaging comes down to the balance of operator duties, sustained throughput, product quality, and the investment required to achieve it.

Sophia

Sophia

Sophia is a dedicated marketing professional with an exceptional depth of knowledge about her company's products and services. With a keen understanding of market trends and customer needs, she crafts insightful blog posts that not only inform but also engage readers, enriching the company’s online......